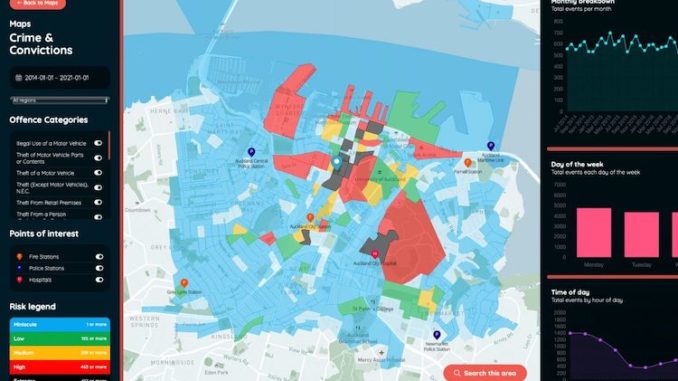
With the launch of the SecIntel security risk intelligence platform in April, Global Risk Consulting-SecIntel Managing Director Chris Kumeroa discusses the value of geomapping in evidence-based security risk analysis.
It’s a simple thesis: an individual’s exposure to a hazard (a potential source of harm) is dependent upon the location of the individual relative to the hazard.
If an individual remains geographically distant from a hazard, it is less likely the hazard will result in harm to them. Conversely, if an individual and a hazard are located at the same place and at the same time, then the likelihood of harm (i.e. risk) to the individual is heightened.
It’s a logic that holds true no matter the hazard – earthquake, weather event, crime or traffic incident. COVID-19 clustering, and physical distancing measures, for example, have demonstrated the importance of geographical proximity in the context of virus transmission and exposure to potential harm. Place is a key element in both the spread and the containment of the pandemic.
In the case of crime, law enforcement concepts such as ‘environmental criminology theory’, ‘routine activities theory’ and ‘place-based policing’ demonstrate the importance of location to risk.
Environmental criminology theory, for example, posits that crime is a complex event in which four things intersect at one time: a law, an offender, a target, and a place.
Crime has distinct geographical patterns, and the geography of crime can be dynamic over time and space. Many place-based policing theories describe the role of place in shaping how crimes cluster and form ‘hotspots’, emphasising the role of place as the key element in crime.
Risk Terrain Modelling, for example, uses geospatial analytics to diagnose environmental conditions that lead to crime and other problems. It brings multiple sources of data together by connecting them to geographic places, and then forecasts risk patterns for certain areas. This can assist law enforcement in deploying resources, preventing crime, and reducing risks.
Place is also important in relation to hazard categories more commonly associated with accident, chance, or ‘act of God’. Traffic incidents, for example, can happen anywhere, but the data tells us that certain locations – or hotspots – play host to disproportionately more incidents than others due to conditions at their specific location.
In the case of natural disasters, some extreme weather events, such as severe storms, can be ‘freakish’ in terms of being geographically indiscriminate, yet location can play a part in others, such as tsunami, flooding, landslides, and geological events.
Locality is thus critical to our understanding of individuals’ security. Understanding the prevalence of hazards in particular geographies enables us to better manage the risk and to achieve better security outcomes.
The SecIntel platform
Achieving visibility of the risk landscape is what SecIntel was designed to do, whether it’s understanding the various hazards prevailing in a single location or gaining situational awareness across a national multi-site network of properties.
There are over 53,500 meshblocks in New Zealand, which are defined by Statistics New Zealand as being “the smallest geographic unit for which statistical data is collected and processed”. SecIntel presents location hazard metrics to the meshblock level, with colour-coded meshblocks depicting differing rates (per capita) of historical crime.
The system also presents premises-specific location and incident data (security and health and safety) for organisations keyed in by their on-premise security/safety team. This enables the heat-mapping of high-severity or high-volume hotspots, contributing to an overall risk picture.
The platform uses these varied open source crime, and incident and threat metrics to identify time of day and day of week patterns, year-on-year trends, and incident type reporting. In doing so, it provides an evidence basis for security risk assessment.
According to A Study on the Influence of Uncertainties in Physical Security Risk Analysis by the European Safety and Reliability Association, “Security risk assessment is often accompanied by great uncertainties, as there is a lack of evidence of threats, consequences and the abilities of security measures. Thus, qualitative or semi-quantitative models that strongly rely on expert knowledge are often used, although these models can lead to misleading or even wrong results.”
On the other hand, Evidence-based risk assessment (EBRA) is the practice of making risk decisions through the judicious identification, evaluation, and application of the most relevant, quantifiable, and statistically valid risk information. This is the space where SecIntel plays.
The platform’s presentation of security, safety and risk-related data can help organisations make evidence-based, commercially sensible and reputationally robust security planning, and policy and operational decisions around security risk.
Quarterly reporting
Back in April we also released SecIntel’s inaugural Security Situation Report (SITREP) covering Q4 2020 (Oct-Dec). This report features high-level regional data that provides insight into the safety and security of New Zealanders through the categories of (i) violent crime, (ii) other crime, (iii) cyberattacks, and (iv) incivility (identity and ideology-based violence).

In terms of Violent Crime, the report found that on a per capita basis, the region with the lowest rate of these crimes was Tasman, followed by Southland. Overall, there was a 14 percent surge in violent crime in Q4 compared to the previous quarter. On a per capita basis the region with the lowest rate of ‘Other Crimes’ was Otago, followed closely by Southland.
In terms of Cyber Attack, NZ CERT data tells us that although Q4 shows a decrease in cyber security incidents from Q3, the numbers of incidents reported are significantly higher than Q4 2019. The Greater Wellington region was the nation’s hot spot for cyber incidents.
Q4 saw Incivility play out in the context of COVID-19, a national election, white nationalism, racist violence and animal activism. Our survey of New Zealand media reportage for Q4 found that the Canterbury region recorded the highest incidence of reported identity and ideology-based violence.
Apart from providing a ‘bird’s eye’ view on security trends across the country from quarter to quarter, the report focuses on key areas of vulnerability. We’ve had excellent feedback on the report from security and risk managers, and it will be available quarterly and free-of-charge via the SecIntel website.
The Q1 2021 SITREP will be released prior to the end of June.


